Applications that DAQ systems can be used for:
There are countless applications for data acquisition. Any physical phenomenon or physical property as a function of time is a candidate for data acquisition. Data acquisition is beneficial in both laboratory and industrial settings. However, with the advent of Internet of Things, data acquisition is now commonplace in the home, small business, or hobbyist garage. Educational applications range from middle school, afterschool programs, science camps, to high schools and universities. Engineering students, professors, and graduate researchers alike use DAQ systems everyday.
Below are some real-world examples of data acquisition applications.
Temperature

Temperature of a system is an important factor that can give insight into numerous characteristics of a system. For example, in a chemical reaction, a decrease in temperature (absorption of energy) reveals that the interaction is endothermic. Conversely, if the system increases in temperature (releases heat) an exothermic reaction has occurred. One reaction studied was the interaction between pigs’ tissue and the hemostatic agent known as QuikClot. By use of a thermocouple, the temperature of the tissue was monitored when put in contact with two variations of QuikClot, one that was the traditional highly exothermic formula, and another that was a non-exothermic version of the product. Through this experiment, the data acquired by the thermocouples enabled successful evaluation of potential burn effects of the traditional QuikClot formula.1
Another useful application of temperature measurement is monitoring the stability of a mechanical system. For example, temperature measurements of an operational motor could yield data about whether the motor is working correctly. A huge spike in temperature could indicate a problem with operation, whereas a consistent temperature would correspond to a functioning system.
The most common sensors used to measure temperature are thermocouples and thermistors. Thermistors measure temperature by changes in their own resistance as the temperature of the system evolves, whereas thermocouples produce a voltage that is directly related to the temperature of the system. Thermistors are generally the more economic option of the two and also do not require any amplification of the signal they produce. Frequently, however, a wheatstone bridge is required for operation. Thermocouples on the other hand are generally more reliable and less susceptible to electrical noise. However, amplification of the thermocouple’s signal is required due to its being in the millivolt range. On any model of the Nyquist, an analog input port would be used, and through this channel the sensor could deliver data for acquisition. The sensors are generally powered by 3.3 V or 5 V, and extra circuit components such as resistors and capacitors are not usually needed for operation.
1 Arnaud, F., Tomori, T., Carr, W. et al. Ann Biomed Eng (2008) 36: 1708
2 Courtesy of Vernier
Light

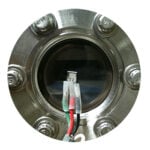
Photocell detecting light from plasma processing chamber.
A photocell is a sensor that can measure the intensity of light. Other light sensors are capable of measuring color (spectrum), or detecting modulated sources.
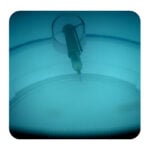
Processing plasma discharge producing detectable light signature.1
Plasma processing is a key technology used in many industries for coating materials from sunglasses, to LCD screens and solar panels. One novel application of light detection is employed to measure the temperature of a processing plasma discharge. Directly measuring a plasma discharge electrically perturbs the discharge itself, so using optical detection method is prefered when permissible. To do so, a DAQ system could be used to collect light intensity at certain wavelengths to determine the excitation signatures of specific noble gasses in the discharge. A Nyquist DAQ device and a few photo sensors (with bandpass coating) could serve this purpose with little physical setup. This could replace thousands of dollars worth of spectroscopy equipment.
1M. V. Malyshev and V. M. Donnelly, “Determination of electron temperatures in plasmas by multiple rare gas optical emission, and implications for advanced actinometry,” Journal of Vacuum Science & Technology A: Vacuum, Surfaces, and Films, vol. 15, no. 3, pp. 550-558, 1997.
Sound
An important application of sound data acquisition is monitoring sound levels in the workplace. The Occupational Safety and Health Administration (OSHA) limits the maximum sound levels and the duration at which sound levels can be sustained. For example, OSHA limits sound levels at 90 dBA to 8 hours. 100 dBA is limited to 15 minutes. For every 3 decibels over 85 dbA, the allowed exposure time is decreased by half. By using a data acquisition system coupled with a microphone, employers can ensure they don’t exceed OSHA limitations.
Sound frequency (Hz) and sound intensity (dB) can be directly measured with an appropriate sensor and DAQ. The microphone is a well known sensor to convert sound waves into analog electrical signals. Often modern compact microphone assemblies contain an amplifier to convert the mechanical vibration mode (electret, piezo, or coil) to a measurable voltage. This voltage can then be logged directly by a DAQ or amplified, filtered or integrated for a particular application. Afterward the data logged by the DAQ can be converted into the frequency domain for further analysis or even simply recorded for playback.
Flow

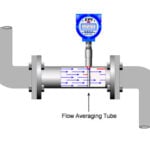
Commercial air flow transducer for HVAC system.2
There are many sensors that measure flow from residential water meters to chemically reactive gas mass flow controllers (MFCs). Flow is measured in a rate and each sensor or controller is typically calibrated for a particular gas or liquid. The output (generally voltage) is proportional to the calibrated metric. This voltage is recorded and processed by the DAQ and software. Flow controllers have the added functionality to maintain a set flow rate as programmed by an input voltage. The DAQ would then set a flow rate using an analog output port and measure the resultant flow with an analog input port. MFCs are generally controlled using 0-5V, 0-10V, or serial RS-232 signals.
2 Courtesy of Eldridge Products, Inc, http://www.epiflow.com/
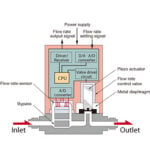
Mass flow controller (MFC) internal diagram.3
Expanding on the mass flow controller concept, a chemical engineer could use a DAQ to measure and control a set of MFCs for a chemical deposition process. Typically, such a process would use a “recipe” to control a temperature, plasma, or other energy source as well as a host of MFCs to produce a chemical coating or film. Once wired to the DAQ, the MFCs would be able to meter the gasses flowing through them and control the rate using a proportional valve and feedback loop. The loop’s input variable would be a voltage from the DAQ as a flow rate set point. For example, 1V signal from the DAQ to the MFC might allow 100 standard cubic centimeters per minute (SCCM) of gas to flow into the reaction chamber.
3Courtesy of Horiba, http://www.horiba.com/
Force

Another key application of data acquisition is the measurement of force in a system. Knowing the amount of force being experienced at various points in a system is crucial to many areas, such as robotic tactile sensing, payload condition assessments, drilling and extraction systems, as well as industrial scales. One example of force measurement application is in the diagnosis of bearing faults in mechanical systems. In 2014 a new method was developed to better understand the nature of bearing faulting by a combined use of a load cell and an accelerometer. Upon conclusion of the study, it was found that the accelerometer shed light on the location of the fault, whereas the load cell was critical to identifying good bearings from defective ones before they were ever used in a construction. In this case, force detection was the difference between a failed system and a successful one.
Load cells are the sensors used to measure force. These sensors come in many different forms, each customized to suit a desired level of accuracy, sensitivity, or physical integration situation. Load cells additionally have differing numbers of measurement axes. For example, the S-type load cell pictured can only measure stretch or compression along one axis, whereas the disc load cell can measure multiple axes of force. When using a load cell, amplification is another consideration. The load cells themselves output a signal in the millivolt range, and thus must be amplified in order to be read by the Nyquist. It is possible to determine the force through conversion of the output voltage based on the load cell’s excitation voltage proportion, which varies depending on the sensor and is represented by raw millivolt signal in a ratio with amplified voltage. Then, through simple unit conversions the desired output units can be achieved. Additionally, different amplifiers have different gains, and some are adjustable to reach the user’s desired gain. Regarding interfacing with any Nyquist model, a load cell (by way of an amplifier) uses an analog input, and can be powered by a varying range of voltages.
4 M.S. Safizadeh, S.K. Latifi, “Using multi-sensor data fusion for vibration fault diagnosis of rolling element bearings by accelerometer and load cell,” Information Fusion, Volume 18, 2014, Pages 1-8, ISSN 1566-2535
Position & Displacement

Measurement of position and displacement has widespread impact upon many different applications. Some applications include backup cameras in cars, vibration sensing of rotating systems, and part identification and design confirmation, among many others.
Two common sensors for measuring change in position are the ultrasonic transducer and the eddy current sensor. Both are robust, capable sensors that thrive in extreme environments involving widespread temperature ranges, high pressure, as well as dirty operating conditions. However, they operate and receive information about displacement in two different ways. The ultrasonic transducer detects the waves produced by the very particles that make up materials when they are exposed to electricity. The transducer acts as both the creator of the electrical signal pulses as well as the receiver of the resulting ultrasonic waves from the material. As proximity to an object changes, so do the waves created by the particulate vibrations. Therefore, based on the changes in the response of the material, the data acquired by the transducer can be used to determine the distance the sensor is from an object.
The second common sensor used in determining displacement is the Eddy current sensor. This device uses magnetic field produced by electromagnetic induction to collect data. In the sensor, as alternating current is initiated, which in turn produces an alternating magnetic field. As the sensor approaches a conductor, the induced magnetic field in the sensor a second induced field, this time in the material itself. Therefore, the sensor then uses the interactions of the two magnetic fields to produce a voltage proportional to the distance between the sensor and the conductor.
Another relevant application of these sensors is Non Destructive Testing and Evaluation of parts. In an experiment conducted in 2006, both Eddy current sensors as well as ultrasonic transducers were used to examine metallic plates for inherent flaws. Through detections in minute height differences on the surfaces of the plates (due to tiny cracks, imperfections, porosities, etc), flaws in the parts were easily discovered and characterized before the plates were put into any kind of applied structure. Through the use of these two sensors, a classification system was developed to help guide the evaluation of parts before implementation.5
Depending on the sensor, either an analog or digital interface can be used to acquire data. Additionally, sensors suitable for use with the Nyquist will generally use a 5 V power. Though the sensors are incredibly good at their jobs, they do require calibration before use.
5 Buonsanti, Michele, et al. “Ultrasonic pulse-echoes and eddy current testing for detection, recognition and characterisation of flaws detected in metallic plates.” Proceedings of the 9th European Conference on Non-Destructive Testing. 2006.
Rotation Speed

When working with any kind of system that has a rotational component, it is often useful to quantify just how fast the component is spinning. This can be done by measuring the revolutions per minute, or RPM. Then, speed itself can be determined from the RPM data.
The most common sensor used to collect RPM measurements is a Hall Effect sensor. This sensor works by way of magnetic detection, and can be either unipolar or bipolar in operation. Unipolar sensors are insensitive to the pole of a magnet and record a signal every time a magnetic field is sensed. Bipolar sensors, conversely, require that both a north pole and a south pole to function. When the sensor picks up on one pole a signal is generated, and it remains in the “on” state until the sensor passes a magnet of the opposite pole, which turns it “off.” Generally, a magnet (or two, depending on the type of sensor) is placed on the component that is spinning, and the sensor is held stationary in a fixed location very close to the rotating piece.6
Just one application of measuring rotation is in a drilling system. In such a system, it is crucial to know how fast the drill is spinning, and this can be determined by readings from a Hall Effect sensor. In the image below, there are many magnets attached to the drill to increase resolution. The data read by the bipolar Hall Effect sensor is then divided by the number of magnets present to determine RPM.
Hall effect sensors can be either digital or analog inputs, and they are frequently powered by 3.3 V or 5 V, depending on the specific sensor.
6 Allwine, Elmer. 1998. “Magnetic Position Sensor Having A Variable Width Magnet Mounted Into A Rotating Disk And A Hall Effect Sensor”. US.
Acceleration

We are all familiar and have experience with acceleration. Acceleration is the rate of change of velocity over time. It’s when you speed up in your car, and it’s the rush back to the ground when you jump. Because acceleration is so integral to our daily lives, acquiring data about acceleration in a system can be extremely useful. The sensor used to do just that is an accelerometer. The general principles on which these sensors operate are change in capacitance and change in voltage, and their capabilities of measurement include both stationary accelerations, such as gravity when you’re standing still on Earth, as well as accelerations due to motion, such as speeding up your car. Essentially, accelerometers can either contain a network of capacitors within the sensor that change levels of capacitance as the accelerometer moves in different directions, or they can house a piezoelectric material that directly outputs voltage under changes in force. These differences in capacitance then produce a change in voltage (or change in voltage may be directly produced, in the case of the piezoelectric type), and through this data acceleration can be determined.7
Accelerometers can measure in up to three axes, and they utilize an analog input. A transistor can frequently be required in the circuitry for using an accelerometer in order to prevent system noise from affecting the sensor data. Additionally, accelerometers require calibration before use.
In terms of application, a study was published in 2008 that represented data acquired from US citizens by accelerometers. The premise of the study was to determine activity levels of Americans among each age group. The participants were asked to wear accelerometers on their person for the duration of a week. Based on the data acquired, researchers accomplished the first official assessment of American activity level. Accelerometers were crucial to the success of the study.1
7 Troiano, Richard P., et al. “Physical activity in the United States measured by accelerometer.” Medicine and science in sports and exercise 40.1 (2008): 181.
pH

Acidity and alkalinity of a solution are measured in a unit called pH (potential of hydrogen). It is measured on a scale of 0 to 14 with 0 being the most acidic, 7 being neutral, and 14 being the most alkaline. This scale is a logarithmic scale, meaning a pH level of 4 is 10 times more acidic than a pH level of 5. This characteristic is measured based on the content of hydrogen (hence the name) in a solution. The more hydrogen present, the more conductive the solution is and therefore the greater electric potential it can produce. Based on this characteristic, a simple method for determining pH can easily be implemented, and that would be through measuring the voltage of a solution.
The sensor that does just that is known as a pH probe. Within the probe is contained both a positive and negative probe, which collectively work as the main probe overall. When the sensor is placed in a solution, a complete circuit is created by the presence of the positive probe, the solution, and the negative probe. Then, based on the voltage produced by the circuit, the pH of the solution is easily determined.
The sensor does not come, however, knowing immediately how to correlate voltage with pH. Therefore, it must be calibrated, and this is done by placing the probe in various solutions of known pH. Once calibrated, the probe is ready to be used in neutral, room temperature conditions. If other variables are introduced to the system, such as pressure and heat, recalibration is
Another form of pH sensing comes through a somewhat newly-developed sensor, which determines pH of a solution optically by use of a polyaniline film. Optical detection of a fixed pH is achieved by observing the amount of absorption of the film at a fixed wavelength of light through the solution, or by varying the wavelength to determine the maximum wavelength absorbed. A change in pH corresponds to a change in the color of the film.8
8 Su, Yongxuan, et al. “An improved optical pH sensor based on polyaniline.” Sensors and Actuators B: Chemical, Volume 71, Issues 1-2, Pages 118-122. 2000.
Combinations of Sensors

It’s often the case that multiple types of sensors are needed to give an understanding of the physical world. Now that we have explored some of the applications of data acquisition with individual sensors, it is easy to see how integration of multiple sensors could be useful for measuring many different types of data.
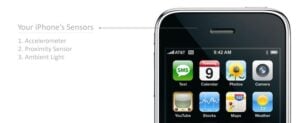
A multi-sensor system is the phrase that can be used to characterize just about every technology we use in daily life. From an iPhone, to a car, to a computer, multiple sensors integrated into unified systems enable advanced acquisition of many different kinds of data. Shown in the figure below are just a few of the many sensors inside an iPhone, a very familiar multi-sensor system.
One example of a worthwhile and important application is the monitoring of patients and elderly people. In 2005, the Simultaneous Tracking and Activity Recognition (STAR) project was published. The goal of this project was to further enable the autonomy of aging people by monitoring them with multiple sensors (including motion, pressure, and contact sensors, among others) inside their own home. This localized system of monitoring allowed elderly people to remain in the comfort of their own home while still giving caretakers, relatives, etc. a full scope of information that could easily be correlated to the health and wellbeing of the elderly.9
Though the examples previously given were of very complicated multi-sensor systems, integration of sensors can be much more simple. For example, something as baseline as an LED lighting up according to certain data values being read by a temperature sensor is still an integrated system. It is fundamental applications such as this that, layered together, can ultimately produce a complex, highly functional system.
9 Wilson D.H., Atkeson C. (2005) “Simultaneous Tracking and Activity Recognition (STAR) Using Many Anonymous, Binary Sensors.” In: Gellersen H.W., Want R., Schmidt A. (eds) Pervasive Computing. Pervasive 2005. Lecture Notes in Computer Science, vol 3468. Springer, Berlin, Heidelberg
